New SaaS Platform Measures Incentive, Recognition, and Loyalty Program Impact
 The Enterprise Engagement Alliance and TM Evolution, a compensation and work life people analytics company, have created a low-cost SaaS platform that makes it easy to measure the impact of incentive, recognition, loyalty programs or any engagement over time.
 How PVIC Works
Suggestions for Reports for Recognition, Sales, Channel, and Meetings Programs
Click here for links to RRN Preferred Solution Providers.
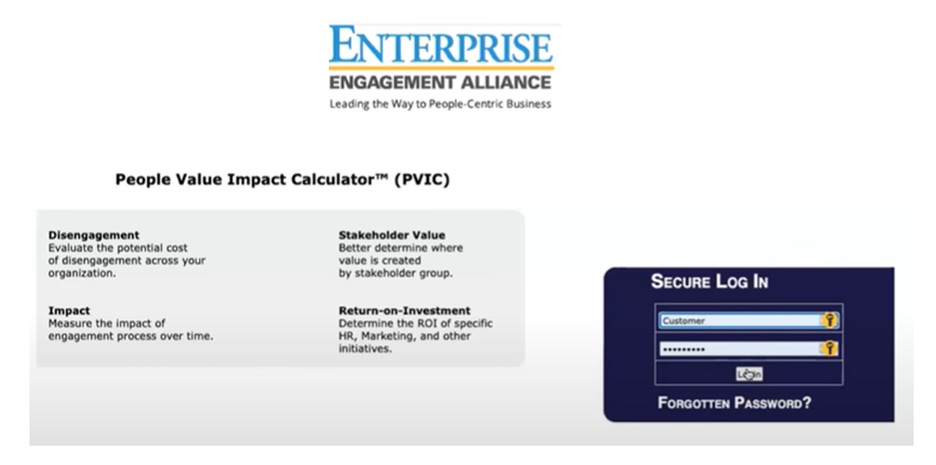
Proponents of incentive, recognition, and loyalty firms often make claims about the benefits of these programs with very little substantive data on their actual impact. The Enterprise Engagement Alliance’s new People Value Impact Calculator (PVIC) is designed to help both corporations and their solution providers do just that. That’s the claim of its creators, Bruce Bolger, Founder of the EEA, and Darwin Hanson, Founder and CEO of Minnesota-based compensation firm TM Evolution, which created the software upon which PVIC is based.
PVIC is an Enterprise Engagement Alliance member benefit and can be licensed and customized to support advisory firms and other solution providers with their own desired set of metrics. For an overview of the platform’s complete stakeholder management measurement capabilities and a recorded demo of the platform in an EEA YouTube show, click here.
“Decades of research demonstrate that effectively designed incentive, recognition, and loyalty programs that holistically address and support the interests of employees, channel partners, customers or any stakeholders provide significant return on investment,” explains Bolger, who as a founding board member and three-year president of the original Incentive Research Foundation, as well as Co-Founder and Managing Director of the Forum for People Performance Management and Measurement at Northwestern University, has had extensive experiencemanaging research in the field. “This platform is designed to give program designers and implementers a tool to not only demonstrate meaningful outcomes but to craft better programs going forward by better understanding the impact of their strategies and tactics.
 The platform is specifically designed to support the return-on-investment processes advocated by the ROI Institute, founded by Jack Phillips, who is a recommended solution provider of the Enterprise Engagement Alliance, and on the Master Measurement Model, statistical process controls commonly used in total quality management applied to people. It was published in the early 2000s by the American Productivity & Quality Center based on a grant from the Incentive Research Foundation to help organizations develop more effective and measurable programs by promoting not only the achievement of desired goals but also the steps judged most critical to achieving them. The report provides concrete examples of measurements for 10 professions.
While PVIC comes with many recommended measures, as demonstrated below, licensees can use any metrics or system they wish. Explains Hanson, “Any company can load data into a spreadsheet. PVIC goes way beyond that by making it easy to share data confidentially with specific stakeholders, correlate all sorts of qualitative and quantitative data on the fly, save reports for future analysis, and to benchmark results over time against aggregate anonymous data.
How PVIC Works
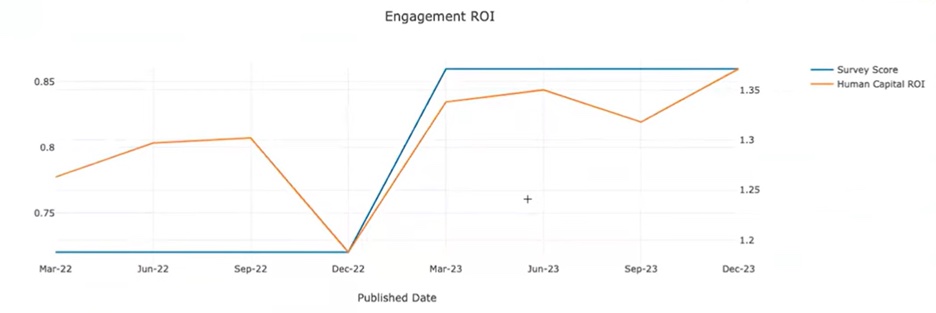
Hanson explains, "PVIC enables administrators to easily plug in the purpose, goals, and objectives of any incentive, recognition, loyalty or any initiative into an Excel spreadsheet, along with a qualitative means of assessing the outcomes. In addition, the spreadsheet includes the specific metrics expected to be enhanced because of the effort, including any calculations designed to weight the data according to organizational priorities, adds Bolger. (For instance, one goal may have a 50% weight; and the two others a 25% weight.) The spreadsheet groups data in whatever time frame the user desires to provide a forecast against which results can be benchmarked over time, he continues. Or he notes, a company can run an analysis of past data to better anticipate future results. The key, they both emphasize, organizations can use whichever data they have or feel is important to their organization.
Once complete, Hanson goes on to explain, the spreadsheet is uploaded into PVIC, usually with just a click of a mouse, immediately providing a baseline enabling organizations to track which elements and/or combination in the program have the greatest impact on results over time. This enables administrators not only to track performance against forecast but also to correlate the various metrics being tracked to see which efforts appear to be producing results or underperforming. The platform enables management to share information with their solution provider partners, to restrict access only to authorized personnel, without providing a record of the company name anywhere in the system for an extra dose of security, Hanson adds.
Suggestions for Reports for Recognition, Sales, Channel, and Meetings Programs
Hanson and Bolger provide suggestions for concrete applications in incentives, rewards, and recognition based on what the organization is seeking to achieve and available data, emphasizing that the platform supports any framework that can be managed in an Excel spreadsheet. The opportunity, the creators say, is to easily correlate data to identify pain points or opportunities and to over time gain invaluable benchmark data to better understand the human dynamics of any initiative. "We would be excited if companies created their own measurement frameworks and sold them to others using the platform for aggregate anonymous benchmarking."
Qualitative analysis. Using a recommended 1-10 rating, or any other numeric scale, organizations can track all the metrics below against whether an its leadership or specific stakeholders feel they achieved the key purpose, goals, and objectives of the annual business plan or specific initiative as well as a consensus rating of how much value or impact is created in the short-, mid-, and long-term by each stakeholder category in a given year or initiative.
DEI (diversity, equity, inclusion analysis.) If the organization provides demographic data, almost all the reports can be broken out by age, gender, ethnicity, etc., providing a concrete view of inclusivity across the enterprise.
Quantitave analysis. Below are suggestions for meaningful data to be collected and correlated against an organization's purpose, goals, objectives, financial and otherwise.
Employee recognition reports.
- Correlation of employee survey scores with turnover and referrals.
- Human resources return on investment (HCROI).
- Cost, sales, and profitability per employee.
- Customer satisfaction, internal or external.
- Number and cost of safety incidents, or other formal complaints related to harassment.
- Participation and scores in training programs.
- Number and value of new ideas submitted.
- Participation and outcome in wellness programs.
- Percentage earning the various tiers of incentive awards.
- Sales and gross profits in participant group.
- Number and value of new customers.
- Number and value of lost customer.
- Number and value of repeat business.
- Number and value of referrals.
- Average revenues, costs, profitability per customer.
- Customer satisfaction scores.
- Employee satisfaction scores.
- New qualified names entered into the permission database for ongoing marketing.
- Participation and scores in training programs.
- Percentage earning the various tiers of incentive awards.
- Sales and gross profits among participant group.
- Number and value of new distributors and/or new customers of current distributors.
- Number and value of lost distributors or customers of current distributors.
- Number and value of repeat business from current distributors.
- Number and value of referrals of new distributors.
- Average revenues, costs, per distributor.
- Distributor and/or distributor sales team satisfaction scores.
- Employee satisfaction scores.
- New qualified names entered into the permission database for ongoing marketing from distributors.
- Participation and scores in training or promotional programs.
- Percentage earning various tiers of awards.
- Percentage earning the various tiers of incentive awards.
- Sales and gross profits.
- Number signed up and active in the program versus number that is not.
- Number and percent who open e-newsletter or social media communications.
- Average revenue per customer of those in loyalty program versus those who are not.
- Customer satisfaction scores of those in the program versus others.
- Average web site visits and duration of loyal versus non-loyalty program participants.
- Percent engaging in sweepstakes, contests, or special promotions.
- Sales and costs per loyalty program participant versus non-participants.
- Number and value of referrals of loyalty program participants versus those who don’t participate.
- The purpose, goals, and objectives of the event and metrics to measure them over a specified time period.
- Overall sales and/or costs associated with stakeholders involved with event. For example, the total sales associated with all distribution partners for a channel incentive program.
- Costs by specific category, travel, food and beverage, speakers and production, gifting programs.
- Percent participation in various programs.
- Attendee satisfaction scores at the event and six months later.
- Number of participants and demographics.
- Percent who took a specific action because of the event, etc., such as engaged in a follow up training program or promotional effort, such as redeeming a reward given at the event.
PVIC is used to help organizations correlate stakeholder investment and impact across the organization. Other applications for PVIC include:
- Evaluating the impact of current and past investments in human resources, sales, marketing, customer service and other engagement efforts to identify strengths and weaknesses.
- Thoroughly analyzing the sources of concrete value creation and risk in mergers and acquisitions.
- Identifying the areas of business most related to short- and long-term value creation to better determine where to focus investments.
- Looking at the impact of training and investment programs on retention or human capital return on investment.
- Tracking the return-on-investment in marketing and communications efforts versus their purpose, goals, and objectives.
- Determining pay equity among management, demographic and other groups.
Bruce Bolger
Founder, Enterprise Engagement Alliance
914-591-7600, ext. 230
Bolger@TheEEA.org
Profit From the “S” of Environmental, Social, Governance (ESG)
Through education, media, business development, advisory services, and outreach, the Enterprise Engagement Alliance supports boards, business analysts, the C-suite, management in finance, marketing, sales, human resources and operations, etc., educators, students and engagement solution providers seeking a competitive advantage by implementing a strategic and systematic approach to stakeholder engagement across the enterprise. Click here for details on all EEA and RRN media services.
1. Professional Education on Stakeholder Management and Total Rewards
- Become part of the EEA as an individual, corporation, or solution provider to gain access to valuable learning, thought leadership, and marketing resources.
- The only education and certification program focusing on Stakeholder Engagement and Human Capital metrics and reporting, featuring seven members-only training videos that provide preparation for certification in Enterprise Engagement.
-
EEA books: Paid EEA participants receive Enterprise Engagement for CEOs: The Little Blue Book for People-
 Centric Capitalists, a quick implementation guide for CEOs; Enterprise Engagement: The Roadmap 5th Edition implementation guide; a comprehensive textbook for practitioners, academics, and students, plus four books on theory and implementation from leaders in Stakeholder Management, Finance, Human Capital Management, and Culture.
- ESM at EnterpriseEngagement.org, EEXAdvisors.com marketplace, ESM e–newsletters, and library.
- RRN at RewardsRecognitionNetwork.com; BrandMediaCoalition.com marketplace, RRN e-newsletters, and library.
- EEA YouTube Channel with over three dozen how-to and insight videos and growing with nearly 100 expert guests.
Strategic Business Development for Stakeholder Management and Total Rewards solution providers, including Integrated blog, social media, and e-newsletter campaigns managed by content marketing experts.
4. Advisory Services for Organizations
Stakeholder Management Business Plans; Human Capital Management, Metrics, and Reporting for organizations, including ISO human capital certifications, and services for solution providers.
5. Outreach in the US and Around the World on Stakeholder Management and Total Rewards
The EEA promotes a strategic approach to people management and total rewards through its e-newsletters, web sites, and social media reaching 20,000 professionals a month and through other activities, such as:
- Association of National Advertisers Brand Engagement 360 Knowledge Center to educate brands and agencies.
- The EEA Engagement widget to promote, track, and measure customers/employee referrals and suggestions that can be connected to any rewards or front-end program management technology.
- The Stakeholder Capitalism free insignia to promote a commitment to better business.
- The BMC Brand Club and transactional storefronts to educate corporate and agency buyers on the IRR market.
- The EME Gold program to educate the top 3% of promotional consultants on selling engagement and rewards services